The problem behind the request
The school wanted to centralise student progress reports. Teachers were working across three physical books and WhatsApp, while keeping their own checklists to avoid missing a student’s report.
The engineering problem was to connect the right school year, class, teacher, student, and family account, while giving teachers control over when information became visible.
My contribution
I mapped the reporting workflow, developed and tested the application, launched it, and continued improving it after real usage exposed friction. Andreansyah Setiawan designed the visual foundations, base interface elements, and login screen. That design contribution is separate from my development and workflow responsibilities.
Model the workflow before the interface
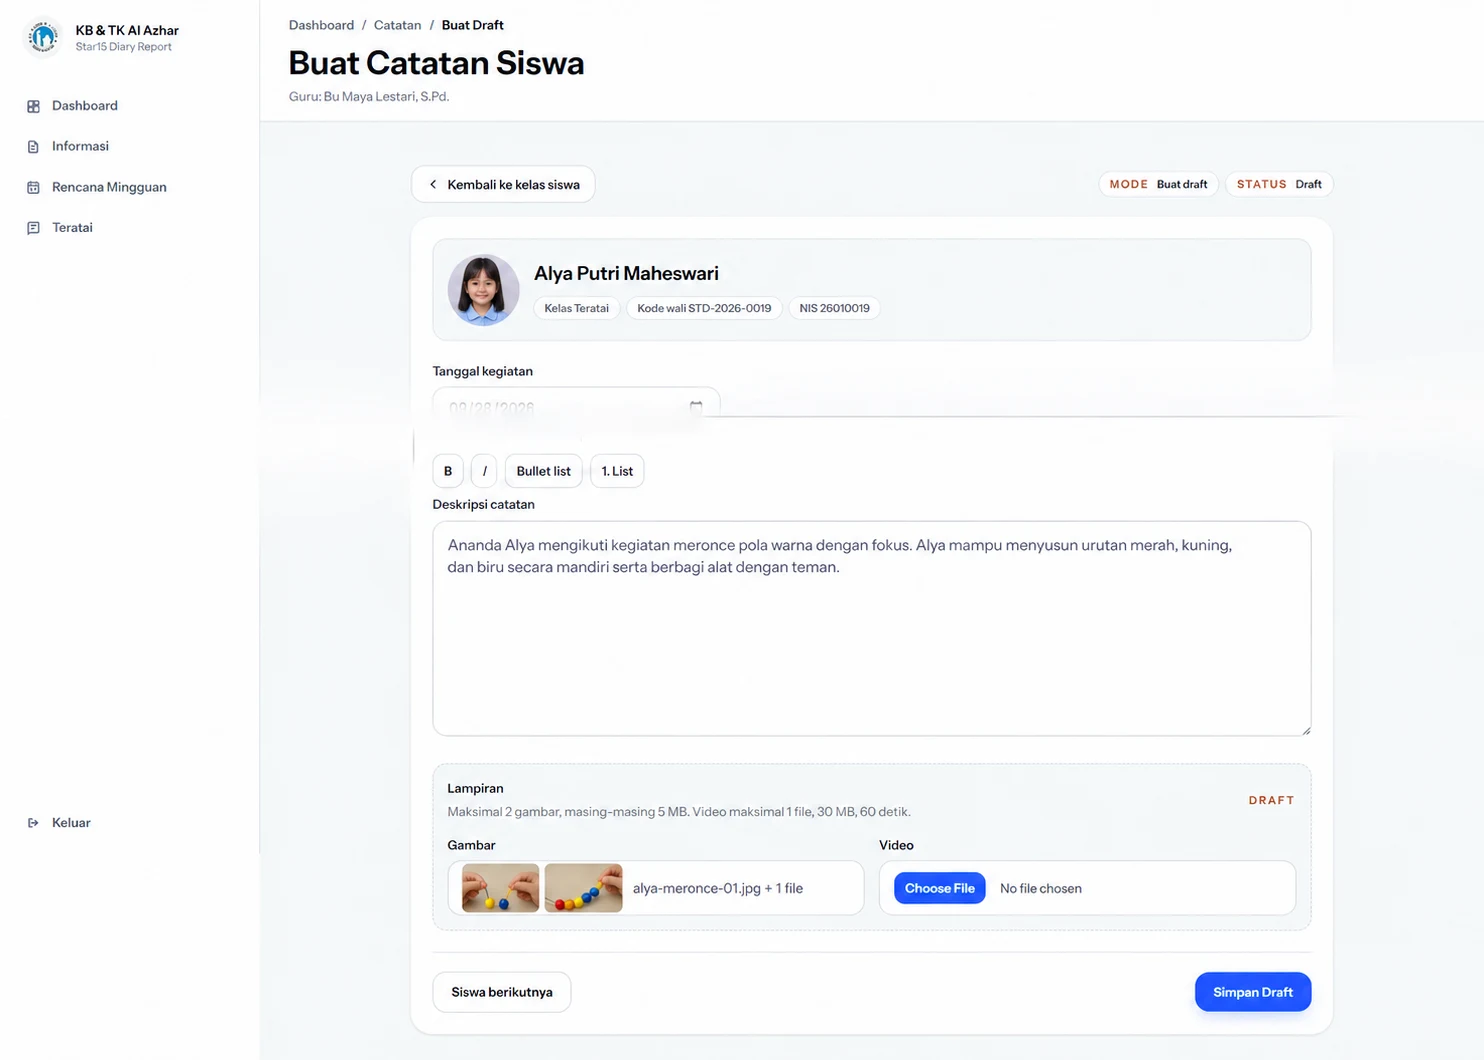
Saving and publishing are separate actions. Teachers can prepare a draft without immediately exposing it to families. Family access is restricted to published reports belonging to a student linked to their account.
The application also supports Excel imports with preview and validation before data is saved, as well as different permissions for school administrators, teachers, and family accounts.
Improve the unit of work
The first version worked for one report, but teachers usually completed reports for a whole class. Returning to the class list and finding the next student repeatedly introduced friction.
I added previous/next student navigation, preserved the class and date context, added unsaved-change reminders, and centralised draft review and bulk publishing. Reactions and comments were attached to each report so the discussion could stay with its context.
What the recorded usage shows
For the period 11 July to 25 September 2026, the audited database export recorded:
- 2,571 published production reports.
- All 18 teachers required to report had published reports.
- Reports for 156 of 157 eligible students, or 99.4% coverage.
- 10 of the 18 required teachers published reports in at least eight separate weeks.
- 80 family/student-access accounts contributed feedback.
Testing accounts were excluded from the production-report metrics. These figures support adoption, repeated use, and participation. They do not establish time saved or prove that every report was read.
Production and quality checks
The application uses Laravel and PostgreSQL. Docker Compose runs the application, Nginx, PostgreSQL, Redis, and separate queue workers on the production VPS. The project uses Git branches, pull requests, GitHub Actions checks, and automated Laravel tests.
In the historical validation of Redis resilience change PR #163, the project recorded 321 passing tests and 1,883 assertions. This is a result for that change, not a claim of complete test coverage or the current test count.
I use an AI-assisted development workflow. The case demonstrates delivery, technical decisions, and validation; it does not imply every line was written without AI or independently reviewed by another human.
What I would measure next
The evidence does not yet quantify teacher time saved, report-reading completion, or reduced rework. Those require separate measurements. A useful next evaluation would distinguish a report being available from a family actually opening and reading it.